无
使用 Siamese 网络和对比损失进行图像相似度估计
作者:Mehdi
创建日期 2021/05/06
最后修改日期 2022/09/10
描述:使用对比损失训练的 Siamese 网络进行相似度学习。
简介
Siamese 网络是指在两个或多个共享权重的网络之间共享权重的神经网络,每个网络都会生成其对应输入的嵌入向量。
在监督相似度学习中,网络随后被训练以最大化不同类别的输入的嵌入之间的对比度(距离),同时最小化相似类别输入的嵌入之间的距离,从而产生反映训练输入类别分割的嵌入空间。
设置
import random
import numpy as np
import keras
from keras import ops
import matplotlib.pyplot as plt
超参数
epochs = 10
batch_size = 16
margin = 1  # Margin for contrastive loss.
加载 MNIST 数据集
(x_train_val, y_train_val), (x_test, y_test) = keras.datasets.mnist.load_data()

# Change the data type to a floating point format
x_train_val = x_train_val.astype("float32")
x_test = x_test.astype("float32")
定义训练集和验证集
# Keep 50% of train_val  in validation set
x_train, x_val = x_train_val[:30000], x_train_val[30000:]
y_train, y_val = y_train_val[:30000], y_train_val[30000:]
del x_train_val, y_train_val
创建图像对
我们将训练模型以区分不同类别的数字。例如,数字 0 需要与其余数字(1 到 9)区分开,数字 1 需要与 0 以及 2 到 9 区分开,以此类推。为了实现这一点,我们将从类别 A(例如,数字 0)中选择 N 张随机图像,并将它们与来自另一个类别 B(例如,数字 1)的 N 张随机图像配对。然后,我们可以为所有数字类别(直到数字 9)重复此过程。一旦我们将数字 0 与其他数字配对,就可以对剩余的数字(从 1 到 9)重复此过程。
def make_pairs(x, y):
    """Creates a tuple containing image pairs with corresponding label.

    Arguments:
        x: List containing images, each index in this list corresponds to one image.
        y: List containing labels, each label with datatype of `int`.

    Returns:
        Tuple containing two numpy arrays as (pairs_of_samples, labels),
        where pairs_of_samples' shape is (2len(x), 2,n_features_dims) and
        labels are a binary array of shape (2len(x)).
    """

    num_classes = max(y) + 1
    digit_indices = [np.where(y == i)[0] for i in range(num_classes)]

    pairs = []
    labels = []

    for idx1 in range(len(x)):
        # add a matching example
        x1 = x[idx1]
        label1 = y[idx1]
        idx2 = random.choice(digit_indices[label1])
        x2 = x[idx2]

        pairs += [[x1, x2]]
        labels += [0]

        # add a non-matching example
        label2 = random.randint(0, num_classes - 1)
        while label2 == label1:
            label2 = random.randint(0, num_classes - 1)

        idx2 = random.choice(digit_indices[label2])
        x2 = x[idx2]

        pairs += [[x1, x2]]
        labels += [1]

    return np.array(pairs), np.array(labels).astype("float32")


# make train pairs
pairs_train, labels_train = make_pairs(x_train, y_train)

# make validation pairs
pairs_val, labels_val = make_pairs(x_val, y_val)

# make test pairs
pairs_test, labels_test = make_pairs(x_test, y_test)
我们得到
pairs_train.shape = (60000, 2, 28, 28)
- 我们有 60,000 对
- 每对包含 2 张图像
- 每张图像的形状为
(28, 28)
拆分训练对
x_train_1 = pairs_train[:, 0]  # x_train_1.shape is (60000, 28, 28)
x_train_2 = pairs_train[:, 1]
拆分验证对
x_val_1 = pairs_val[:, 0]  # x_val_1.shape = (60000, 28, 28)
x_val_2 = pairs_val[:, 1]
拆分测试对
x_test_1 = pairs_test[:, 0]  # x_test_1.shape = (20000, 28, 28)
x_test_2 = pairs_test[:, 1]
可视化图像对及其标签
def visualize(pairs, labels, to_show=6, num_col=3, predictions=None, test=False):
    """Creates a plot of pairs and labels, and prediction if it's test dataset.

    Arguments:
        pairs: Numpy Array, of pairs to visualize, having shape
               (Number of pairs, 2, 28, 28).
        to_show: Int, number of examples to visualize (default is 6)
                `to_show` must be an integral multiple of `num_col`.
                 Otherwise it will be trimmed if it is greater than num_col,
                 and incremented if if it is less then num_col.
        num_col: Int, number of images in one row - (default is 3)
                 For test and train respectively, it should not exceed 3 and 7.
        predictions: Numpy Array of predictions with shape (to_show, 1) -
                     (default is None)
                     Must be passed when test=True.
        test: Boolean telling whether the dataset being visualized is
              train dataset or test dataset - (default False).

    Returns:
        None.
    """

    # Define num_row
    # If to_show % num_col != 0
    #    trim to_show,
    #       to trim to_show limit num_row to the point where
    #       to_show % num_col == 0
    #
    # If to_show//num_col == 0
    #    then it means num_col is greater then to_show
    #    increment to_show
    #       to increment to_show set num_row to 1
    num_row = to_show // num_col if to_show // num_col != 0 else 1

    # `to_show` must be an integral multiple of `num_col`
    #  we found num_row and we have num_col
    #  to increment or decrement to_show
    #  to make it integral multiple of `num_col`
    #  simply set it equal to num_row * num_col
    to_show = num_row * num_col

    # Plot the images
    fig, axes = plt.subplots(num_row, num_col, figsize=(5, 5))
    for i in range(to_show):
        # If the number of rows is 1, the axes array is one-dimensional
        if num_row == 1:
            ax = axes[i % num_col]
        else:
            ax = axes[i // num_col, i % num_col]

        ax.imshow(ops.concatenate([pairs[i][0], pairs[i][1]], axis=1), cmap="gray")
        ax.set_axis_off()
        if test:
            ax.set_title("True: {} | Pred: {:.5f}".format(labels[i], predictions[i][0]))
        else:
            ax.set_title("Label: {}".format(labels[i]))
    if test:
        plt.tight_layout(rect=(0, 0, 1.9, 1.9), w_pad=0.0)
    else:
        plt.tight_layout(rect=(0, 0, 1.5, 1.5))
    plt.show()
检查训练对
visualize(pairs_train[:-1], labels_train[:-1], to_show=4, num_col=4)

检查验证对
visualize(pairs_val[:-1], labels_val[:-1], to_show=4, num_col=4)

检查测试对
visualize(pairs_test[:-1], labels_test[:-1], to_show=4, num_col=4)

定义模型
有两个输入层,每个输入层都通向自己的网络,该网络产生嵌入。然后,一个 Lambda 层使用欧几里得距离将它们合并,并将合并后的输出馈送到最终网络。
# Provided two tensors t1 and t2
# Euclidean distance = sqrt(sum(square(t1-t2)))
def euclidean_distance(vects):
    """Find the Euclidean distance between two vectors.

    Arguments:
        vects: List containing two tensors of same length.

    Returns:
        Tensor containing euclidean distance
        (as floating point value) between vectors.
    """

    x, y = vects
    sum_square = ops.sum(ops.square(x - y), axis=1, keepdims=True)
    return ops.sqrt(ops.maximum(sum_square, keras.backend.epsilon()))


input = keras.layers.Input((28, 28, 1))
x = keras.layers.BatchNormalization()(input)
x = keras.layers.Conv2D(4, (5, 5), activation="tanh")(x)
x = keras.layers.AveragePooling2D(pool_size=(2, 2))(x)
x = keras.layers.Conv2D(16, (5, 5), activation="tanh")(x)
x = keras.layers.AveragePooling2D(pool_size=(2, 2))(x)
x = keras.layers.Flatten()(x)

x = keras.layers.BatchNormalization()(x)
x = keras.layers.Dense(10, activation="tanh")(x)
embedding_network = keras.Model(input, x)


input_1 = keras.layers.Input((28, 28, 1))
input_2 = keras.layers.Input((28, 28, 1))

# As mentioned above, Siamese Network share weights between
# tower networks (sister networks). To allow this, we will use
# same embedding network for both tower networks.
tower_1 = embedding_network(input_1)
tower_2 = embedding_network(input_2)

merge_layer = keras.layers.Lambda(euclidean_distance, output_shape=(1,))(
    [tower_1, tower_2]
)
normal_layer = keras.layers.BatchNormalization()(merge_layer)
output_layer = keras.layers.Dense(1, activation="sigmoid")(normal_layer)
siamese = keras.Model(inputs=[input_1, input_2], outputs=output_layer)
定义对比损失
def loss(margin=1):
    """Provides 'contrastive_loss' an enclosing scope with variable 'margin'.

    Arguments:
        margin: Integer, defines the baseline for distance for which pairs
                should be classified as dissimilar. - (default is 1).

    Returns:
        'contrastive_loss' function with data ('margin') attached.
    """

    # Contrastive loss = mean( (1-true_value) * square(prediction) +
    #                         true_value * square( max(margin-prediction, 0) ))
    def contrastive_loss(y_true, y_pred):
        """Calculates the contrastive loss.

        Arguments:
            y_true: List of labels, each label is of type float32.
            y_pred: List of predictions of same length as of y_true,
                    each label is of type float32.

        Returns:
            A tensor containing contrastive loss as floating point value.
        """

        square_pred = ops.square(y_pred)
        margin_square = ops.square(ops.maximum(margin - (y_pred), 0))
        return ops.mean((1 - y_true) * square_pred + (y_true) * margin_square)

    return contrastive_loss
使用对比损失编译模型
siamese.compile(loss=loss(margin=margin), optimizer="RMSprop", metrics=["accuracy"])
siamese.summary()
Model: "functional_3"
┏━━━━━━━━━━━━━━━━━━━━━┳━━━━━━━━━━━━━━━━━━━┳━━━━━━━━━┳━━━━━━━━━━━━━━━━━━━━━━┓
┃ Layer (type)        ┃ Output Shape      ┃ Param # ┃ Connected to         ┃
┡━━━━━━━━━━━━━━━━━━━━━╇━━━━━━━━━━━━━━━━━━━╇━━━━━━━━━╇━━━━━━━━━━━━━━━━━━━━━━┩
│ input_layer_1       │ (None, 28, 28, 1) │       0 │ -                    │
│ (InputLayer)        │                   │         │                      │
├─────────────────────┼───────────────────┼─────────┼──────────────────────┤
│ input_layer_2       │ (None, 28, 28, 1) │       0 │ -                    │
│ (InputLayer)        │                   │         │                      │
├─────────────────────┼───────────────────┼─────────┼──────────────────────┤
│ functional_1        │ (None, 10)        │   5,318 │ input_layer_1[0][0], │
│ (Functional)        │                   │         │ input_layer_2[0][0]  │
├─────────────────────┼───────────────────┼─────────┼──────────────────────┤
│ lambda (Lambda)     │ (None, 1)         │       0 │ functional_1[0][0],  │
│                     │                   │         │ functional_1[1][0]   │
├─────────────────────┼───────────────────┼─────────┼──────────────────────┤
│ batch_normalizatio… │ (None, 1)         │       4 │ lambda[0][0]         │
│ (BatchNormalizatio… │                   │         │                      │
├─────────────────────┼───────────────────┼─────────┼──────────────────────┤
│ dense_1 (Dense)     │ (None, 1)         │       2 │ batch_normalization… │
└─────────────────────┴───────────────────┴─────────┴──────────────────────┘
Total params: 5,324 (20.80 KB)
Trainable params: 4,808 (18.78 KB)
Non-trainable params: 516 (2.02 KB)
训练模型
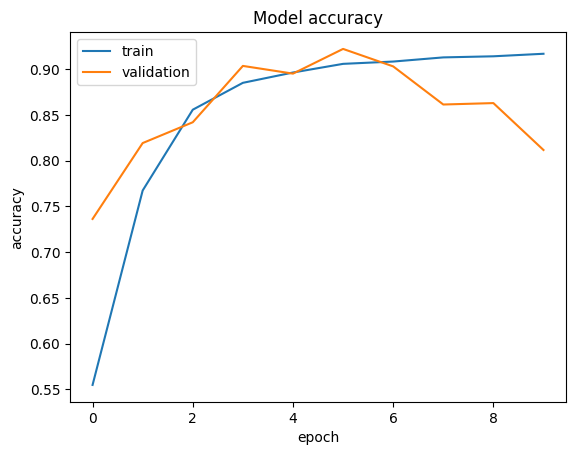
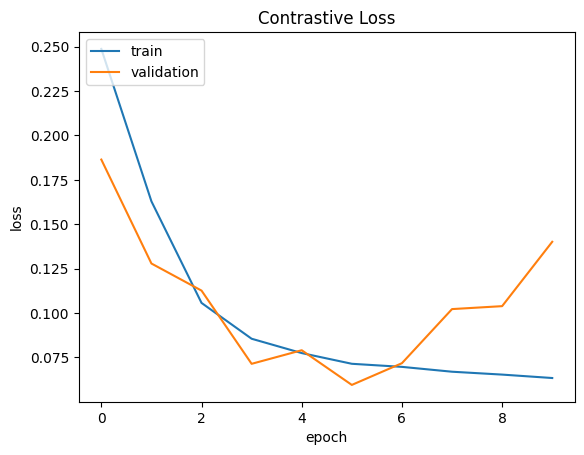
history = siamese.fit(
    [x_train_1, x_train_2],
    labels_train,
    validation_data=([x_val_1, x_val_2], labels_val),
    batch_size=batch_size,
    epochs=epochs,
)
Epoch 1/10
 3750/3750 ━━━━━━━━━━━━━━━━━━━━ 16s 3ms/step - accuracy: 0.4802 - loss: 0.2768 - val_accuracy: 0.7363 - val_loss: 0.1864
Epoch 2/10
 3750/3750 ━━━━━━━━━━━━━━━━━━━━ 11s 3ms/step - accuracy: 0.7368 - loss: 0.1827 - val_accuracy: 0.8193 - val_loss: 0.1279
Epoch 3/10
 3750/3750 ━━━━━━━━━━━━━━━━━━━━ 11s 3ms/step - accuracy: 0.8480 - loss: 0.1117 - val_accuracy: 0.8420 - val_loss: 0.1126
Epoch 4/10
 3750/3750 ━━━━━━━━━━━━━━━━━━━━ 11s 3ms/step - accuracy: 0.8834 - loss: 0.0871 - val_accuracy: 0.9037 - val_loss: 0.0714
Epoch 5/10
 3750/3750 ━━━━━━━━━━━━━━━━━━━━ 11s 3ms/step - accuracy: 0.8932 - loss: 0.0797 - val_accuracy: 0.8952 - val_loss: 0.0791
Epoch 6/10
 3750/3750 ━━━━━━━━━━━━━━━━━━━━ 11s 3ms/step - accuracy: 0.9047 - loss: 0.0721 - val_accuracy: 0.9223 - val_loss: 0.0595
Epoch 7/10
 3750/3750 ━━━━━━━━━━━━━━━━━━━━ 11s 3ms/step - accuracy: 0.9070 - loss: 0.0704 - val_accuracy: 0.9032 - val_loss: 0.0718
Epoch 8/10
 3750/3750 ━━━━━━━━━━━━━━━━━━━━ 11s 3ms/step - accuracy: 0.9122 - loss: 0.0680 - val_accuracy: 0.8615 - val_loss: 0.1022
Epoch 9/10
 3750/3750 ━━━━━━━━━━━━━━━━━━━━ 11s 3ms/step - accuracy: 0.9132 - loss: 0.0664 - val_accuracy: 0.8630 - val_loss: 0.1039
Epoch 10/10
 3750/3750 ━━━━━━━━━━━━━━━━━━━━ 11s 3ms/step - accuracy: 0.9187 - loss: 0.0621 - val_accuracy: 0.8117 - val_loss: 0.1401
可视化结果
def plt_metric(history, metric, title, has_valid=True):
    """Plots the given 'metric' from 'history'.

    Arguments:
        history: history attribute of History object returned from Model.fit.
        metric: Metric to plot, a string value present as key in 'history'.
        title: A string to be used as title of plot.
        has_valid: Boolean, true if valid data was passed to Model.fit else false.

    Returns:
        None.
    """
    plt.plot(history[metric])
    if has_valid:
        plt.plot(history["val_" + metric])
        plt.legend(["train", "validation"], loc="upper left")
    plt.title(title)
    plt.ylabel(metric)
    plt.xlabel("epoch")
    plt.show()


# Plot the accuracy
plt_metric(history=history.history, metric="accuracy", title="Model accuracy")

# Plot the contrastive loss
plt_metric(history=history.history, metric="loss", title="Contrastive Loss")


评估模型
results = siamese.evaluate([x_test_1, x_test_2], labels_test)
print("test loss, test acc:", results)
 625/625 ━━━━━━━━━━━━━━━━━━━━ 1s 1ms/step - accuracy: 0.8068 - loss: 0.1439
test loss, test acc: [0.13836927711963654, 0.8143500089645386]
可视化预测结果
predictions = siamese.predict([x_test_1, x_test_2])
visualize(pairs_test, labels_test, to_show=3, predictions=predictions, test=True)
625/625 ━━━━━━━━━━━━━━━━━━━━ 1s 619us/step
