用于天气预测的时间序列预测
作者: Prabhanshu Attri, Yashika Sharma, Kristi Takach, Falak Shah
创建日期 2020/06/23
最后修改日期 2023/11/22
描述: 本notebook演示了如何使用LSTM模型进行时间序列预测。
设置
import pandas as pd
import matplotlib.pyplot as plt
import keras
气候数据时间序列
我们将使用由 Max Planck Institute for Biogeochemistry 记录的耶拿气候数据集。该数据集包含温度、压力、湿度等14个特征,每10分钟记录一次。
地点:德国耶拿 Max Planck Institute for Biogeochemistry 气象站
考虑的时间范围:2009年1月10日 - 2016年12月31日
下表显示了列名、它们的数值格式及其描述。
| 索引 | 特征 | 格式 | 描述 |
|---|---|---|---|
| 1 | 日期时间 | 01.01.2009 00:10:00 | 日期时间参考 |
| 2 | p (mbar) | 996.52 | 帕斯卡是用于量化内部压力的SI导出单位。气象报告通常以毫巴表示大气压力。 |
| 3 | T (degC) | -8.02 | 摄氏温度 |
| 4 | Tpot (K) | 265.4 | 开尔文温度 |
| 5 | Tdew (degC) | -8.9 | 与湿度相关的摄氏温度。露点是空气中绝对含水量的衡量标准,露点是空气无法容纳所有水分并导致水凝结的温度。 |
| 6 | rh (%) | 93.3 | 相对湿度是衡量空气中水蒸气饱和程度的指标,%RH决定了采集物体中含水量。 |
| 7 | VPmax (mbar) | 3.33 | 饱和蒸汽压 |
| 8 | VPact (mbar) | 3.11 | 蒸汽压 |
| 9 | VPdef (mbar) | 0.22 | 蒸汽压亏损 |
| 10 | sh (g/kg) | 1.94 | 比湿 |
| 11 | H2OC (mmol/mol) | 3.12 | 水蒸气浓度 |
| 12 | rho (g/m ** 3) | 1307.75 | 空气密度 |
| 13 | wv (m/s) | 1.03 | 风速 |
| 14 | max. wv (m/s) | 1.75 | 最大风速 |
| 15 | wd (deg) | 152.3 | 风向(度) |
from zipfile import ZipFile

uri = "https://storage.googleapis.com/tensorflow/tf-keras-datasets/jena_climate_2009_2016.csv.zip"
zip_path = keras.utils.get_file(origin=uri, fname="jena_climate_2009_2016.csv.zip")
zip_file = ZipFile(zip_path)
zip_file.extractall()
csv_path = "jena_climate_2009_2016.csv"

df = pd.read_csv(csv_path)
原始数据可视化
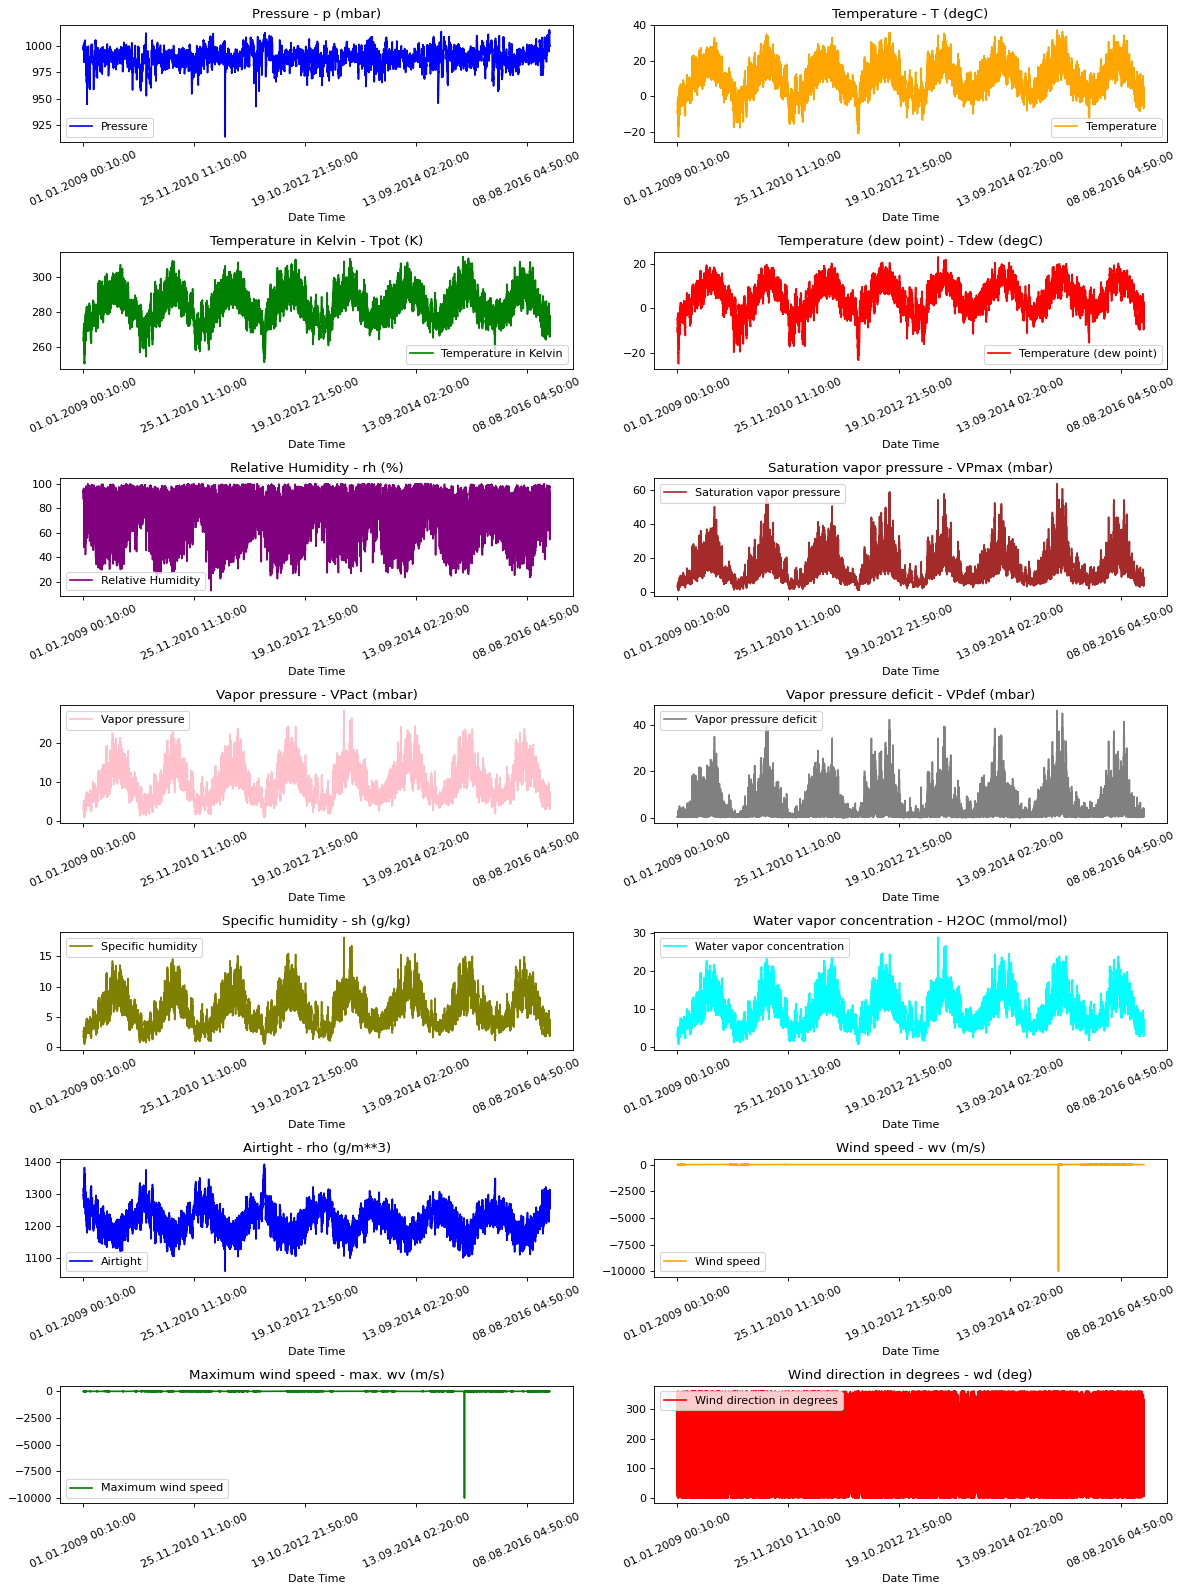
为了让我们对正在处理的数据有所了解,下面绘制了每个特征的图。这显示了从2009年到2016年期间每个特征的独特模式。它还显示了异常值的位置,这些异常值将在归一化期间处理。
titles = [
    "Pressure",
    "Temperature",
    "Temperature in Kelvin",
    "Temperature (dew point)",
    "Relative Humidity",
    "Saturation vapor pressure",
    "Vapor pressure",
    "Vapor pressure deficit",
    "Specific humidity",
    "Water vapor concentration",
    "Airtight",
    "Wind speed",
    "Maximum wind speed",
    "Wind direction in degrees",
]

feature_keys = [
    "p (mbar)",
    "T (degC)",
    "Tpot (K)",
    "Tdew (degC)",
    "rh (%)",
    "VPmax (mbar)",
    "VPact (mbar)",
    "VPdef (mbar)",
    "sh (g/kg)",
    "H2OC (mmol/mol)",
    "rho (g/m**3)",
    "wv (m/s)",
    "max. wv (m/s)",
    "wd (deg)",
]

colors = [
    "blue",
    "orange",
    "green",
    "red",
    "purple",
    "brown",
    "pink",
    "gray",
    "olive",
    "cyan",
]

date_time_key = "Date Time"


def show_raw_visualization(data):
    time_data = data[date_time_key]
    fig, axes = plt.subplots(
        nrows=7, ncols=2, figsize=(15, 20), dpi=80, facecolor="w", edgecolor="k"
    )
    for i in range(len(feature_keys)):
        key = feature_keys[i]
        c = colors[i % (len(colors))]
        t_data = data[key]
        t_data.index = time_data
        t_data.head()
        ax = t_data.plot(
            ax=axes[i // 2, i % 2],
            color=c,
            title="{} - {}".format(titles[i], key),
            rot=25,
        )
        ax.legend([titles[i]])
    plt.tight_layout()


show_raw_visualization(df)
数据预处理
这里我们选取约300,000个数据点进行训练。观测数据每10分钟记录一次,这意味着每小时记录6次。我们将每小时重采样一个点,因为预计60分钟内不会发生剧烈变化。我们通过 timeseries_dataset_from_array 工具函数中的 sampling_rate 参数来实现这一点。
我们跟踪过去720个时间戳的数据(720/6=120小时)。这些数据将用于预测72个时间戳(72/6=12小时)后的温度。
由于每个特征的值范围不同,我们在训练神经网络之前进行归一化,将特征值限制在 [0, 1] 的范围内。我们通过减去每个特征的均值并除以其标准差来实现这一点。
71.5%的数据将用于训练模型,即300,693行。可以更改 split_fraction 来调整此百分比。
模型使用前5天的数据进行训练,即720个观测值,每小时采样一次。72个观测值(12小时 * 每小时6个观测值)后的温度将用作标签。
split_fraction = 0.715
train_split = int(split_fraction * int(df.shape[0]))
step = 6

past = 720
future = 72
learning_rate = 0.001
batch_size = 256
epochs = 10


def normalize(data, train_split):
    data_mean = data[:train_split].mean(axis=0)
    data_std = data[:train_split].std(axis=0)
    return (data - data_mean) / data_std
从相关性热力图中可以看出,一些参数如相对湿度和比湿存在冗余。因此,我们将只使用部分选定的特征,而不是全部。
print(
    "The selected parameters are:",
    ", ".join([titles[i] for i in [0, 1, 5, 7, 8, 10, 11]]),
)
selected_features = [feature_keys[i] for i in [0, 1, 5, 7, 8, 10, 11]]
features = df[selected_features]
features.index = df[date_time_key]
features.head()

features = normalize(features.values, train_split)
features = pd.DataFrame(features)
features.head()

train_data = features.loc[0 : train_split - 1]
val_data = features.loc[train_split:]
The selected parameters are: Pressure, Temperature, Saturation vapor pressure, Vapor pressure deficit, Specific humidity, Airtight, Wind speed
训练数据集
训练数据集的标签从第792个观测值(720 + 72)开始。
start = past + future
end = start + train_split

x_train = train_data[[i for i in range(7)]].values
y_train = features.iloc[start:end][[1]]

sequence_length = int(past / step)
timeseries_dataset_from_array 函数接受按相等间隔收集的数据点序列,以及时间序列参数,例如序列/窗口的长度、两个序列/窗口之间的间距等,以从主时间序列中采样生成子时间序列输入和目标的批次。
dataset_train = keras.preprocessing.timeseries_dataset_from_array(
    x_train,
    y_train,
    sequence_length=sequence_length,
    sampling_rate=step,
    batch_size=batch_size,
)
验证数据集
验证数据集不能包含最后792行,因为这些记录没有标签数据,因此必须从数据末尾减去792行。
验证标签数据集必须从训练分割后的792开始,因此我们必须将过去 + 未来 (792) 添加到 label_start 中。
x_end = len(val_data) - past - future

label_start = train_split + past + future

x_val = val_data.iloc[:x_end][[i for i in range(7)]].values
y_val = features.iloc[label_start:][[1]]

dataset_val = keras.preprocessing.timeseries_dataset_from_array(
    x_val,
    y_val,
    sequence_length=sequence_length,
    sampling_rate=step,
    batch_size=batch_size,
)


for batch in dataset_train.take(1):
    inputs, targets = batch

print("Input shape:", inputs.numpy().shape)
print("Target shape:", targets.numpy().shape)
Input shape: (256, 120, 7)
Target shape: (256, 1)
训练
inputs = keras.layers.Input(shape=(inputs.shape[1], inputs.shape[2]))
lstm_out = keras.layers.LSTM(32)(inputs)
outputs = keras.layers.Dense(1)(lstm_out)

model = keras.Model(inputs=inputs, outputs=outputs)
model.compile(optimizer=keras.optimizers.Adam(learning_rate=learning_rate), loss="mse")
model.summary()
CUDA backend failed to initialize: Found cuSOLVER version 11405, but JAX was built against version 11502, which is newer. The copy of cuSOLVER that is installed must be at least as new as the version against which JAX was built. (Set TF_CPP_MIN_LOG_LEVEL=0 and rerun for more info.)
Model: "functional_1"
┏━━━━━━━━━━━━━━━━━━━━━━━━━━━━━━━━━┳━━━━━━━━━━━━━━━━━━━━━━━━━━━┳━━━━━━━━━━━━┓
┃ Layer (type)                    ┃ Output Shape              ┃    Param # ┃
┡━━━━━━━━━━━━━━━━━━━━━━━━━━━━━━━━━╇━━━━━━━━━━━━━━━━━━━━━━━━━━━╇━━━━━━━━━━━━┩
│ input_layer (InputLayer)        │ (None, 120, 7)            │          0 │
├─────────────────────────────────┼───────────────────────────┼────────────┤
│ lstm (LSTM)                     │ (None, 32)                │      5,120 │
├─────────────────────────────────┼───────────────────────────┼────────────┤
│ dense (Dense)                   │ (None, 1)                 │         33 │
└─────────────────────────────────┴───────────────────────────┴────────────┘
Total params: 5,153 (20.13 KB)
Trainable params: 5,153 (20.13 KB)
Non-trainable params: 0 (0.00 B)
我们将使用 ModelCheckpoint 回调定期保存检查点,并使用 EarlyStopping 回调在验证损失不再改善时中断训练。
path_checkpoint = "model_checkpoint.weights.h5"
es_callback = keras.callbacks.EarlyStopping(monitor="val_loss", min_delta=0, patience=5)

modelckpt_callback = keras.callbacks.ModelCheckpoint(
    monitor="val_loss",
    filepath=path_checkpoint,
    verbose=1,
    save_weights_only=True,
    save_best_only=True,
)

history = model.fit(
    dataset_train,
    epochs=epochs,
    validation_data=dataset_val,
    callbacks=[es_callback, modelckpt_callback],
)
Epoch 1/10
1172/1172 ━━━━━━━━━━━━━━━━━━━━ 0s 70ms/step - loss: 0.3008
Epoch 1: val_loss improved from inf to 0.15039, saving model to model_checkpoint.weights.h5
1172/1172 ━━━━━━━━━━━━━━━━━━━━ 104s 88ms/step - loss: 0.3007 - val_loss: 0.1504
Epoch 2/10
1171/1172 ━━━━━━━━━━━━━━━━━━━[37m━ 0s 66ms/step - loss: 0.1397
Epoch 2: val_loss improved from 0.15039 to 0.14231, saving model to model_checkpoint.weights.h5
1172/1172 ━━━━━━━━━━━━━━━━━━━━ 97s 83ms/step - loss: 0.1396 - val_loss: 0.1423
Epoch 3/10
1171/1172 ━━━━━━━━━━━━━━━━━━━[37m━ 0s 69ms/step - loss: 0.1242
Epoch 3: val_loss did not improve from 0.14231
1172/1172 ━━━━━━━━━━━━━━━━━━━━ 101s 86ms/step - loss: 0.1242 - val_loss: 0.1513
Epoch 4/10
1172/1172 ━━━━━━━━━━━━━━━━━━━━ 0s 68ms/step - loss: 0.1182
Epoch 4: val_loss did not improve from 0.14231
1172/1172 ━━━━━━━━━━━━━━━━━━━━ 102s 87ms/step - loss: 0.1182 - val_loss: 0.1503
Epoch 5/10
1171/1172 ━━━━━━━━━━━━━━━━━━━[37m━ 0s 67ms/step - loss: 0.1160
Epoch 5: val_loss did not improve from 0.14231
1172/1172 ━━━━━━━━━━━━━━━━━━━━ 100s 85ms/step - loss: 0.1160 - val_loss: 0.1500
Epoch 6/10
1171/1172 ━━━━━━━━━━━━━━━━━━━[37m━ 0s 69ms/step - loss: 0.1130
Epoch 6: val_loss did not improve from 0.14231
1172/1172 ━━━━━━━━━━━━━━━━━━━━ 100s 86ms/step - loss: 0.1130 - val_loss: 0.1469
Epoch 7/10
1172/1172 ━━━━━━━━━━━━━━━━━━━━ 0s 70ms/step - loss: 0.1106
Epoch 7: val_loss improved from 0.14231 to 0.13916, saving model to model_checkpoint.weights.h5
1172/1172 ━━━━━━━━━━━━━━━━━━━━ 104s 89ms/step - loss: 0.1106 - val_loss: 0.1392
Epoch 8/10
1171/1172 ━━━━━━━━━━━━━━━━━━━[37m━ 0s 66ms/step - loss: 0.1097
Epoch 8: val_loss improved from 0.13916 to 0.13257, saving model to model_checkpoint.weights.h5
1172/1172 ━━━━━━━━━━━━━━━━━━━━ 98s 84ms/step - loss: 0.1097 - val_loss: 0.1326
Epoch 9/10
1171/1172 ━━━━━━━━━━━━━━━━━━━[37m━ 0s 68ms/step - loss: 0.1075
Epoch 9: val_loss improved from 0.13257 to 0.13057, saving model to model_checkpoint.weights.h5
1172/1172 ━━━━━━━━━━━━━━━━━━━━ 100s 85ms/step - loss: 0.1075 - val_loss: 0.1306
Epoch 10/10
1172/1172 ━━━━━━━━━━━━━━━━━━━━ 0s 66ms/step - loss: 0.1065
Epoch 10: val_loss improved from 0.13057 to 0.12671, saving model to model_checkpoint.weights.h5
1172/1172 ━━━━━━━━━━━━━━━━━━━━ 98s 84ms/step - loss: 0.1065 - val_loss: 0.1267
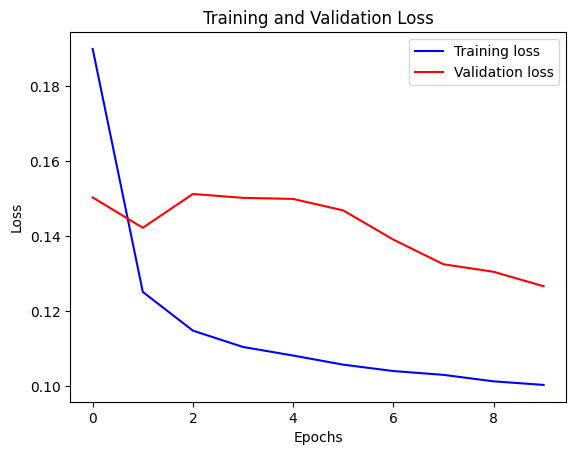
我们可以使用下面的函数可视化损失。在某个点之后,损失停止下降。
def visualize_loss(history, title):
    loss = history.history["loss"]
    val_loss = history.history["val_loss"]
    epochs = range(len(loss))
    plt.figure()
    plt.plot(epochs, loss, "b", label="Training loss")
    plt.plot(epochs, val_loss, "r", label="Validation loss")
    plt.title(title)
    plt.xlabel("Epochs")
    plt.ylabel("Loss")
    plt.legend()
    plt.show()


visualize_loss(history, "Training and Validation Loss")
预测
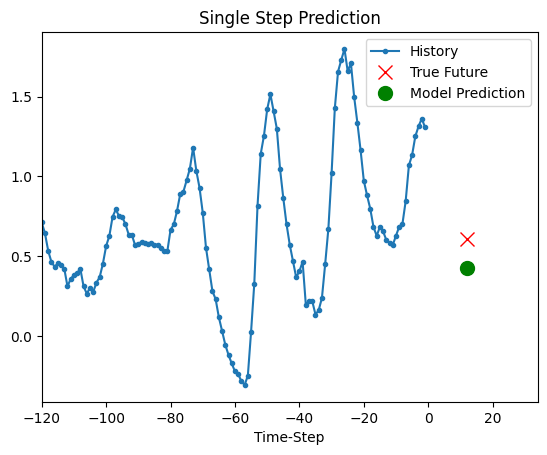
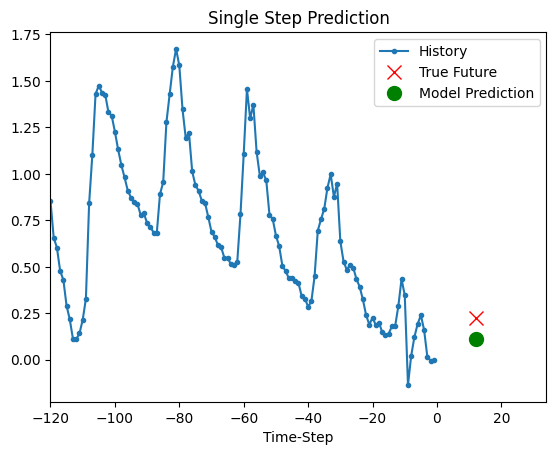
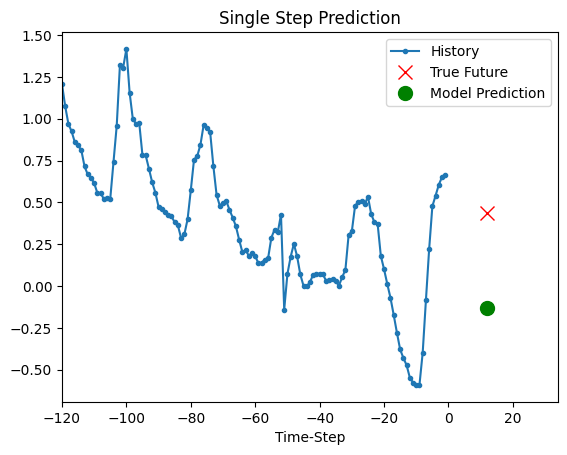
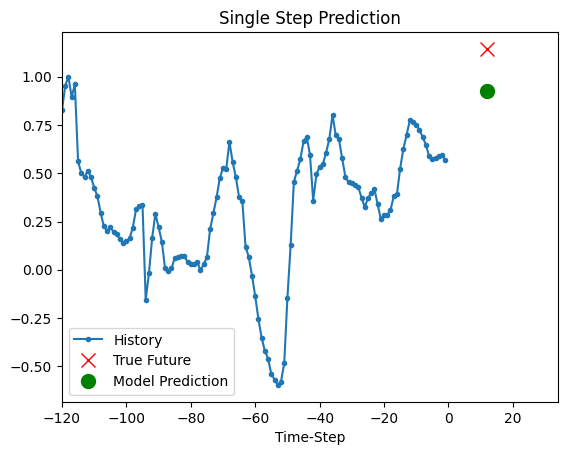
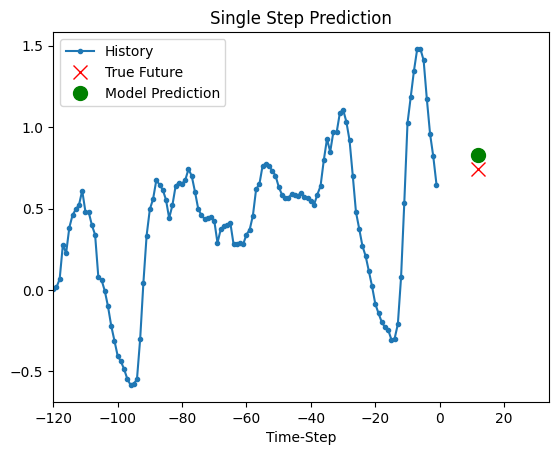
上面训练好的模型现在能够对验证集中的5组值进行预测。
def show_plot(plot_data, delta, title):
    labels = ["History", "True Future", "Model Prediction"]
    marker = [".-", "rx", "go"]
    time_steps = list(range(-(plot_data[0].shape[0]), 0))
    if delta:
        future = delta
    else:
        future = 0

    plt.title(title)
    for i, val in enumerate(plot_data):
        if i:
            plt.plot(future, plot_data[i], marker[i], markersize=10, label=labels[i])
        else:
            plt.plot(time_steps, plot_data[i].flatten(), marker[i], label=labels[i])
    plt.legend()
    plt.xlim([time_steps[0], (future + 5) * 2])
    plt.xlabel("Time-Step")
    plt.show()
    return


for x, y in dataset_val.take(5):
    show_plot(
        [x[0][:, 1].numpy(), y[0].numpy(), model.predict(x)[0]],
        12,
        "Single Step Prediction",
    )
8/8 ━━━━━━━━━━━━━━━━━━━━ 0s 4ms/step
8/8 ━━━━━━━━━━━━━━━━━━━━ 0s 4ms/step
8/8 ━━━━━━━━━━━━━━━━━━━━ 0s 5ms/step
8/8 ━━━━━━━━━━━━━━━━━━━━ 0s 5ms/step
8/8 ━━━━━━━━━━━━━━━━━━━━ 0s 4ms/step
